Chapter 13 — Data Collection, Processing, Interpretation & Reporting
13.1 Introduction
Data are only valuable when they are collected reliably, processed consistently, interpreted correctly, and reported to the people who can act. This chapter covers the last execution links of the chain — the ones that convert readings into decisions.
13.2 Data collection
- Frequency should match the rate of change: read more often when the risk is highest (during critical construction stages, after rainfall, after seismic events).
- Use field data sheets (Figure 12-2 shows a typical probe-extensometer sheet) so that raw readings, instrument ID, and conditions are captured consistently.
- Record the factors that may influence the data — weather, construction activity, load, and temperature — alongside the reading, so cause and effect can later be established.
13.3 Processing and presentation
- Convert raw readings to engineering units using the current calibration.
- Present data as time-series plots and, where relevant, as profile plots (e.g., inclinometer deflection with depth).
- Plot the influencing factors on the same time axis — load, rainfall, pond level — so that relationships are visible.
13.4 Interpretation
Interpretation asks what the data mean, not merely what the numbers are:
- Compare against predicted magnitudes from planning (Chapter 6).
- Look for cause-and-effect relationships — for example, settlement of soft ground below an embankment plotted against fill height (Figure 12-3).
- Identify trends and rates — a steady rate of movement is more alarming than a single reading.
- Be alert to instrument error before concluding the ground is behaving abnormally.
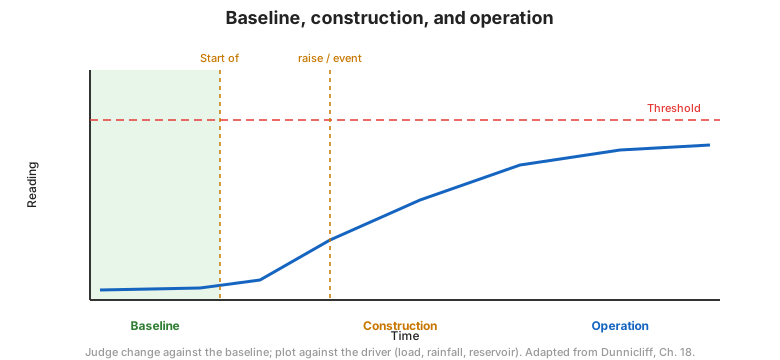
Figure. Interpreting a monitoring time series: baseline, construction response, and a developing trend that triggers action (after FHWA-HI-98-034, Ch. 12–13).
13.5 Reporting
Reports must be clear and timely:
- State the conclusion and the action required, not just the readings.
- Show the data against thresholds and predicted values.
- Distribute reports to everyone who needs to act, on a schedule that matches the risk.
13.6 Student exercise — evaluation of data
The manual includes a student exercise on the evaluation of data, with suggested evaluations in Appendix F (see Chapter 14). Examples include interpreting optical survey data and identifying correct vs. erroneous inclinometer data — the practical skill of separating signal from noise.
13.7 Implementation — the final link
The chain is not complete until the data are implemented: a decision is made, an action is taken, and the outcome is recorded. Monitoring that never changes a decision has failed, regardless of how good the instruments were.
13.8 Key takeaways
- Read more often when risk is highest.
- Record the influencing factors with every reading.
- Plot and interpret against predicted magnitudes and thresholds.
- Separate signal from noise — check the instrument before blaming the ground.
- Report to the decision-makers, and implement — that is the point.