Chapter 13 — Data Collection, Processing & Interpretation
13.1 Data only matters if it is used
A shelf of读数 logs is not monitoring. This chapter covers turning raw readings into decisions.
13.2 Initial readings and baseline
- Take initial (baseline) readings after installation and after settlement stabilizes.
- Multiple initial readings reduce the effect of transient disturbance.
- The baseline is the reference against which all future change is judged.
13.3 Reading frequency
Frequency depends on:
- Parameter dynamics (fast-moving during construction; slow in steady operation).
- Life stage and risk category.
- Event-driven increases after storms, earthquakes, or anomalies.
Too infrequent misses rapid change; too frequent wastes effort. Tune it.
13.4 Automated systems
Automated data acquisition supports high frequency, continuous coverage, and alarms — essential where movement can accelerate quickly. It demands the same validation and maintenance discipline as manual reading.
13.5 Validation and processing
Before use, data is checked for plausibility, continuity, and calibration drift, and corrected for temperature and environmental effects. Gaps are documented, not hidden.
13.6 Presentation and interpretation
Effective presentation reveals signal:
- Time-series against driving variables (load, rainfall, season).
- Cross-plots (e.g., movement vs. pore pressure).
- Profiles with depth or distance.
Interpretation asks: does measured behavior match expected? A deviation triggers evaluation, not panic — and acceleration is the earliest warning.
Plot against the driver
A pore-pressure time-series alone is hard to read; plotted against reservoir or rainfall level, the relationship — and any anomaly — becomes obvious.
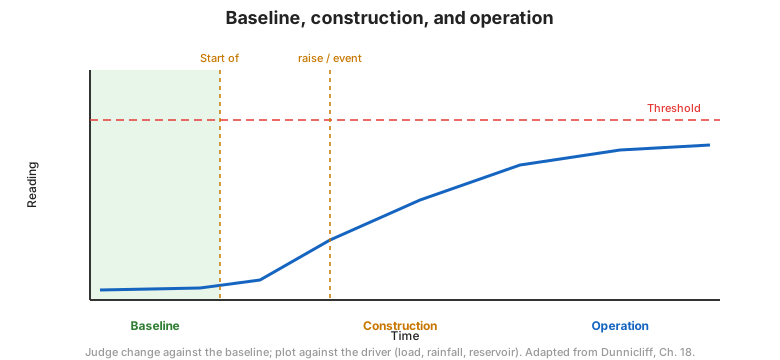
Figure. From baseline to operation. Judge change against the baseline and plot readings against the driving variable (Dunnicliff, Ch. 18).
13.7 Key takeaways
- Establish baseline readings; judge change against them.
- Tune frequency to dynamics, life stage, and risk.
- Validate, correct, and document gaps before interpreting.
- Plot against driving variables to reveal signal.